MVP Ratio Statistics Playoff History Playoff
Chart in PDF Regular Season Schedule
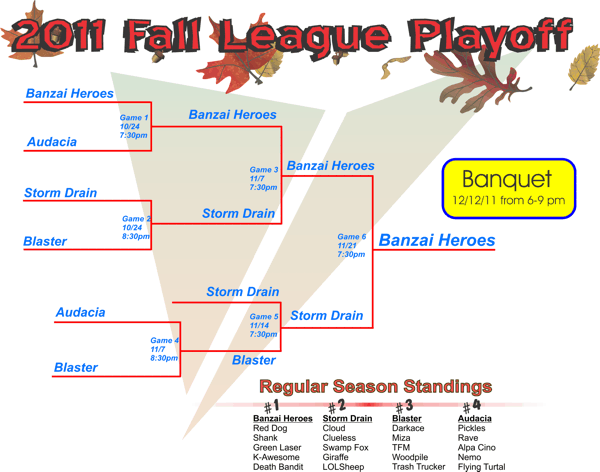
Playoff Statistics
top
|
MVP |
|
Hit |
|
Player Hits |
|
Player Hits |
|
Arena Hits |
|
Games |
|
Rank |
|
Nick Name |
Ratio |
|
Ratio |
|
Given |
|
Taken |
|
Given |
|
Shots |
|
Accuracy |
|
Played |
|
1 |
|
Red Dog |
17.0 |
|
14.5 |
|
240 |
|
153 |
|
3 |
|
3325 |
|
7.31% |
|
6 |
|
2 |
|
Darkace |
7.0 |
|
7.0 |
|
132 |
|
90 |
|
0 |
|
3187 |
|
4.14% |
|
6 |
|
3 |
|
Miza |
6.5 |
|
-3.5 |
|
88 |
|
102 |
|
8 |
|
1825 |
|
5.26% |
|
4 |
|
4 |
|
Cloud |
6.3 |
|
0.0 |
|
172 |
|
172 |
|
10 |
|
3127 |
|
5.82% |
|
8 |
|
5 |
|
Pickles |
5.8 |
|
5.8 |
|
71 |
|
48 |
|
0 |
|
1298 |
|
5.47% |
|
4 |
|
6 |
|
LOLSheep |
3.0 |
|
3.0 |
|
53 |
|
29 |
|
0 |
|
3091 |
|
1.71% |
|
8 |
|
7 |
|
Swamp Fox |
3.0 |
|
3.0 |
|
138 |
|
114 |
|
0 |
|
3819 |
|
3.61% |
|
8 |
|
8 |
|
Flying TurtAl |
2.5 |
|
2.5 |
|
33 |
|
23 |
|
0 |
|
794 |
|
4.16% |
|
4 |
|
9 |
|
Death Bandit |
2.0 |
|
2.0 |
|
27 |
|
23 |
|
0 |
|
300 |
|
9.00% |
|
2 |
|
10 |
|
Clueless |
1.9 |
|
-0.6 |
|
121 |
|
126 |
|
4 |
|
3430 |
|
3.64% |
|
8 |
|
11 |
|
Rave |
0.5 |
|
0.5 |
|
52 |
|
51 |
|
0 |
|
2133 |
|
2.44% |
|
2 |
|
12 |
|
Woodpile |
0.0 |
|
0.0 |
|
0 |
|
0 |
|
0 |
|
1 |
|
0.00% |
|
0 |
|
13 |
|
K-awesome |
-0.5 |
|
-0.5 |
|
35 |
|
38 |
|
0 |
|
760 |
|
4.61% |
|
6 |
|
14 |
|
Shank |
-2.5 |
|
-2.5 |
|
47 |
|
57 |
|
0 |
|
1679 |
|
2.80% |
|
4 |
|
15 |
|
Tax Fraud Mike |
-4.0 |
|
-4.0 |
|
65 |
|
89 |
|
0 |
|
4120 |
|
1.58% |
|
6 |
|
16 |
|
Giraffe |
-4.5 |
|
-4.5 |
|
15 |
|
42 |
|
0 |
|
2226 |
|
0.67% |
|
6 |
|
17 |
|
Nemo |
-4.5 |
|
-4.5 |
|
25 |
|
43 |
|
0 |
|
1504 |
|
1.66% |
|
4 |
|
18 |
|
Alpa Cino |
-5.3 |
|
-6.5 |
|
64 |
|
90 |
|
1 |
|
1354 |
|
4.80% |
|
4 |
|
19 |
|
Green Laser |
-6.5 |
|
-6.5 |
|
61 |
|
100 |
|
0 |
|
2537 |
|
2.40% |
|
6 |
|
20 |
|
Trash Trucker |
-7.0 |
|
-7.0 |
|
51 |
|
93 |
|
0 |
|
1105 |
|
4.62% |
|
6 |
|
Monday, November 21, 2011 |
Page 1 of 1 |


