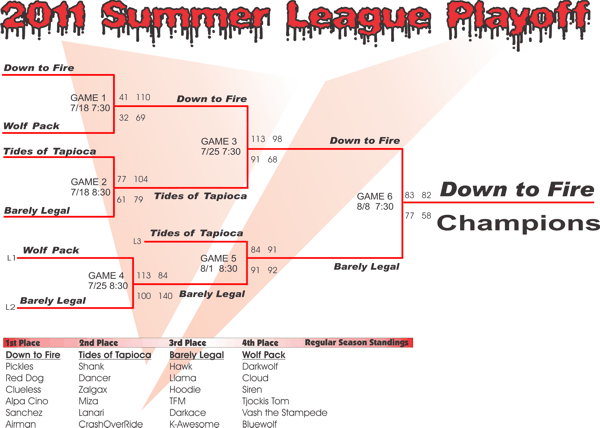
MVP Ratio Statistics Playoff History Playoff
Chart in PDF Regular Season Schedule
Playoff Statistics
|
MVP |
|
Hit |
|
Player Hits |
|
Player Hits |
|
Arena Hits |
|
Games |
|
Rank |
|
Nick Name |
Ratio |
|
Ratio |
|
Given |
|
Taken |
|
Given |
|
Shots |
|
Accuracy |
|
Played |
|
1 |
|
Red Dog |
21.0 |
|
16.8 |
|
198 |
|
97 |
|
5 |
|
2340 |
|
8.68% |
|
6 |
|
2 |
|
Dancer |
9.8 |
|
9.8 |
|
148 |
|
89 |
|
0 |
|
2362 |
|
6.27% |
|
6 |
|
3 |
|
Hoodie |
5.4 |
|
2.9 |
|
107 |
|
84 |
|
4 |
|
1956 |
|
5.67% |
|
8 |
|
4 |
|
Llama |
5.2 |
|
-0.7 |
|
95 |
|
99 |
|
7 |
|
1290 |
|
7.91% |
|
6 |
|
5 |
|
Darkace |
5.0 |
|
5.0 |
|
103 |
|
63 |
|
0 |
|
2293 |
|
4.49% |
|
8 |
|
6 |
|
Miza |
4.0 |
|
-4.3 |
|
97 |
|
123 |
|
10 |
|
1832 |
|
5.84% |
|
6 |
|
7 |
|
Zalgax |
4.0 |
|
0.3 |
|
86 |
|
85 |
|
3 |
|
907 |
|
9.81% |
|
4 |
|
8 |
|
Pickles |
3.5 |
|
3.5 |
|
28 |
|
14 |
|
0 |
|
506 |
|
5.53% |
|
4 |
|
9 |
|
Cloud |
1.0 |
|
-2.8 |
|
30 |
|
41 |
|
3 |
|
501 |
|
6.59% |
|
4 |
|
10 |
|
Hawk |
0.7 |
|
0.7 |
|
67 |
|
63 |
|
0 |
|
1041 |
|
6.44% |
|
6 |
|
11 |
|
CrashOverride |
0.5 |
|
0.5 |
|
11 |
|
10 |
|
0 |
|
169 |
|
6.51% |
|
2 |
|
12 |
|
Shank |
0.0 |
|
0.0 |
|
73 |
|
73 |
|
0 |
|
3941 |
|
1.85% |
|
6 |
|
13 |
|
Blue Wolf |
0.0 |
|
0.0 |
|
0 |
|
0 |
|
0 |
|
1 |
|
0.00% |
|
0 |
|
14 |
|
Air Man |
0.0 |
|
0.0 |
|
0 |
|
0 |
|
0 |
|
1 |
|
0.00% |
|
2 |
|
15 |
|
Alpa Cino |
-0.3 |
|
-2.8 |
|
44 |
|
61 |
|
3 |
|
989 |
|
4.75% |
|
6 |
|
16 |
|
Sanchez |
-2.3 |
|
-2.3 |
|
46 |
|
55 |
|
0 |
|
1838 |
|
2.50% |
|
4 |
|
17 |
|
K-awesome |
-2.4 |
|
-2.4 |
|
18 |
|
37 |
|
0 |
|
265 |
|
6.79% |
|
8 |
|
18 |
|
Tax Fraud Mike |
-2.7 |
|
-2.7 |
|
77 |
|
93 |
|
0 |
|
2671 |
|
2.88% |
|
6 |
|
19 |
|
Tjockis Tom |
-4.0 |
|
-4.0 |
|
22 |
|
38 |
|
0 |
|
1035 |
|
2.13% |
|
4 |
|
20 |
|
Lanari |
-6.0 |
|
-6.0 |
|
57 |
|
93 |
|
0 |
|
1216 |
|
4.69% |
|
6 |
|
Tuesday, August 09, 2011 |
Page 1 of 1 |
top


